I help organizations understand where risk concentrates and why — through rigorous spatial analysis, clear cartography and actionable reports. Available for international projects.
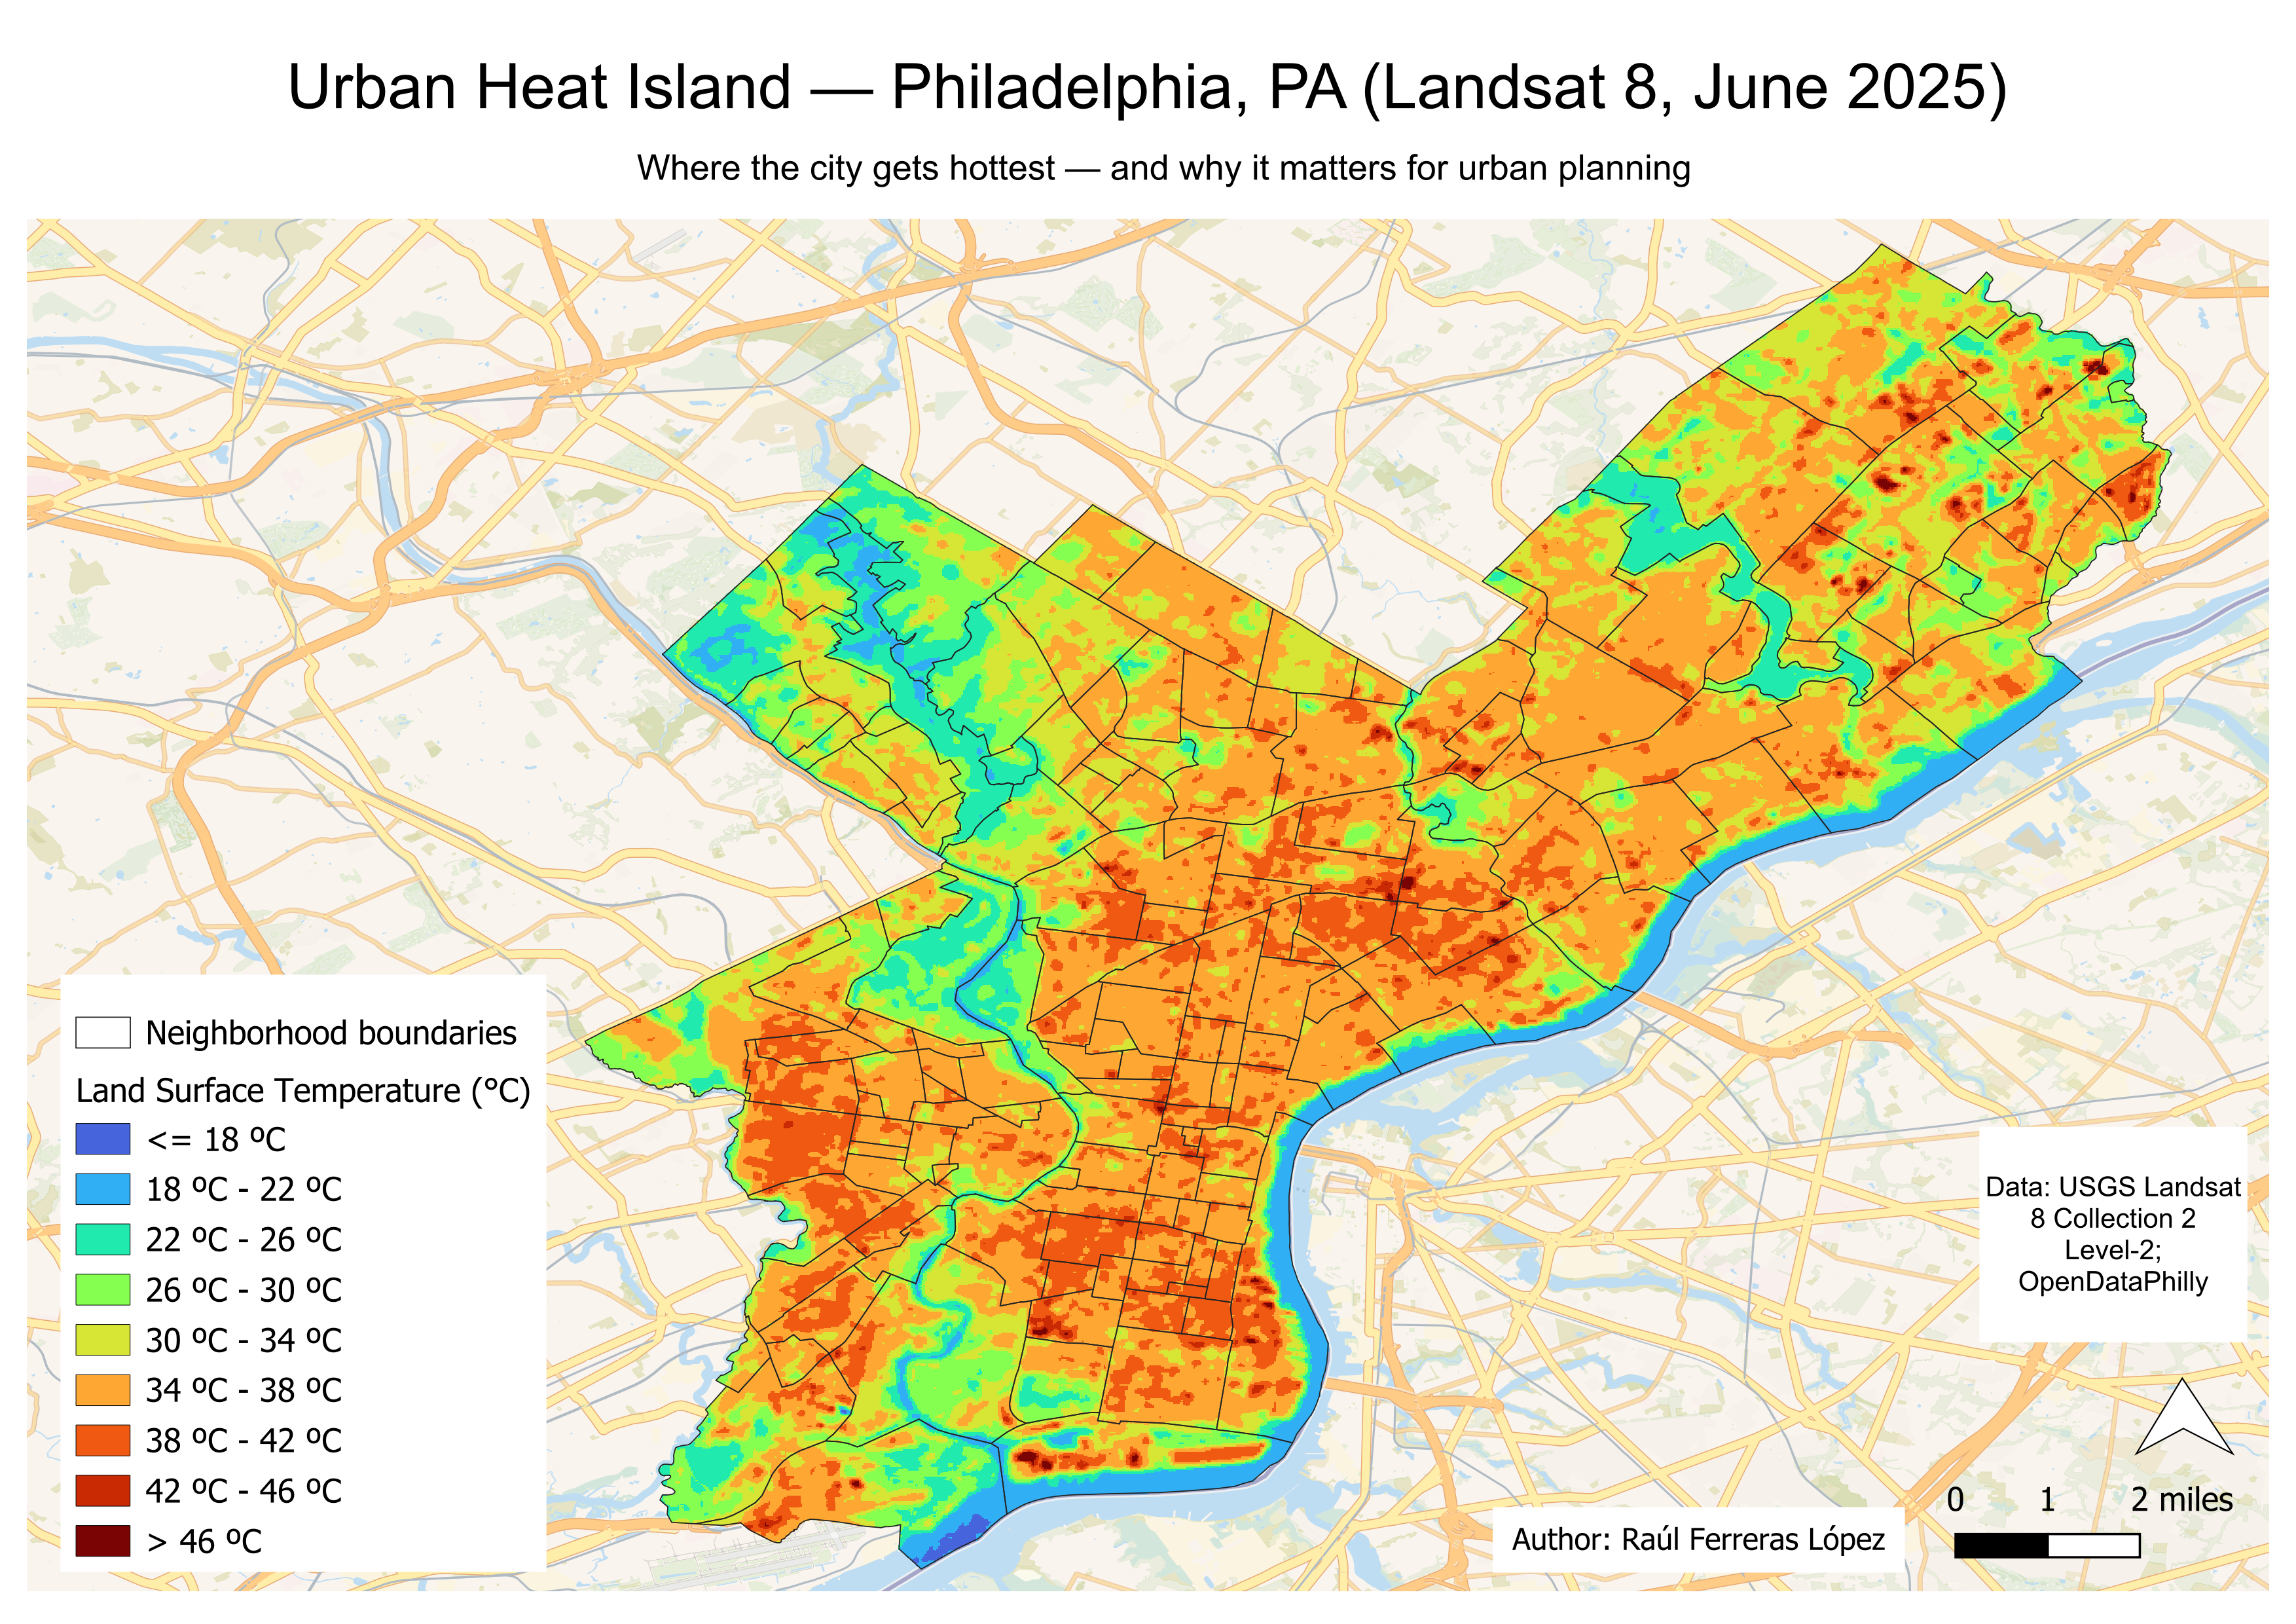
Identify where Philadelphia's urban heat concentrates at the neighborhood scale and quantify the temperature gap between the hottest built-up districts and the city's green and riparian corridors — providing spatial evidence for heat-equity and urban greening policy.
Land Surface Temperature (LST) retrieval from Landsat 8 Band 10 (TIRS) using the radiometric calibration and emissivity correction workflow (USGS Collection 2, Level-2). Thermal classification into nine LST ranges (≤18 °C to >46 °C) overlaid with OpenDataPhilly neighborhood boundaries. Spatial pattern analysis to identify hotspot corridors, riverfront cooling effects and intra-city temperature differentials reaching over 28 °C.
High-resolution LST map revealing a pronounced heat island in central and south Philadelphia (38–46+ °C) against cooler green and waterfront buffers (18–26 °C). The analysis provides a neighborhood-level evidence base directly applicable to heat action planning, urban tree-canopy prioritization and climate-resilience investment.
🎯 Business Impact: Enables ESG consultancies and urban planners to prioritize infrastructure investments and secure climate-resilience funding by translating complex thermal data into clear, actionable intervention zones.
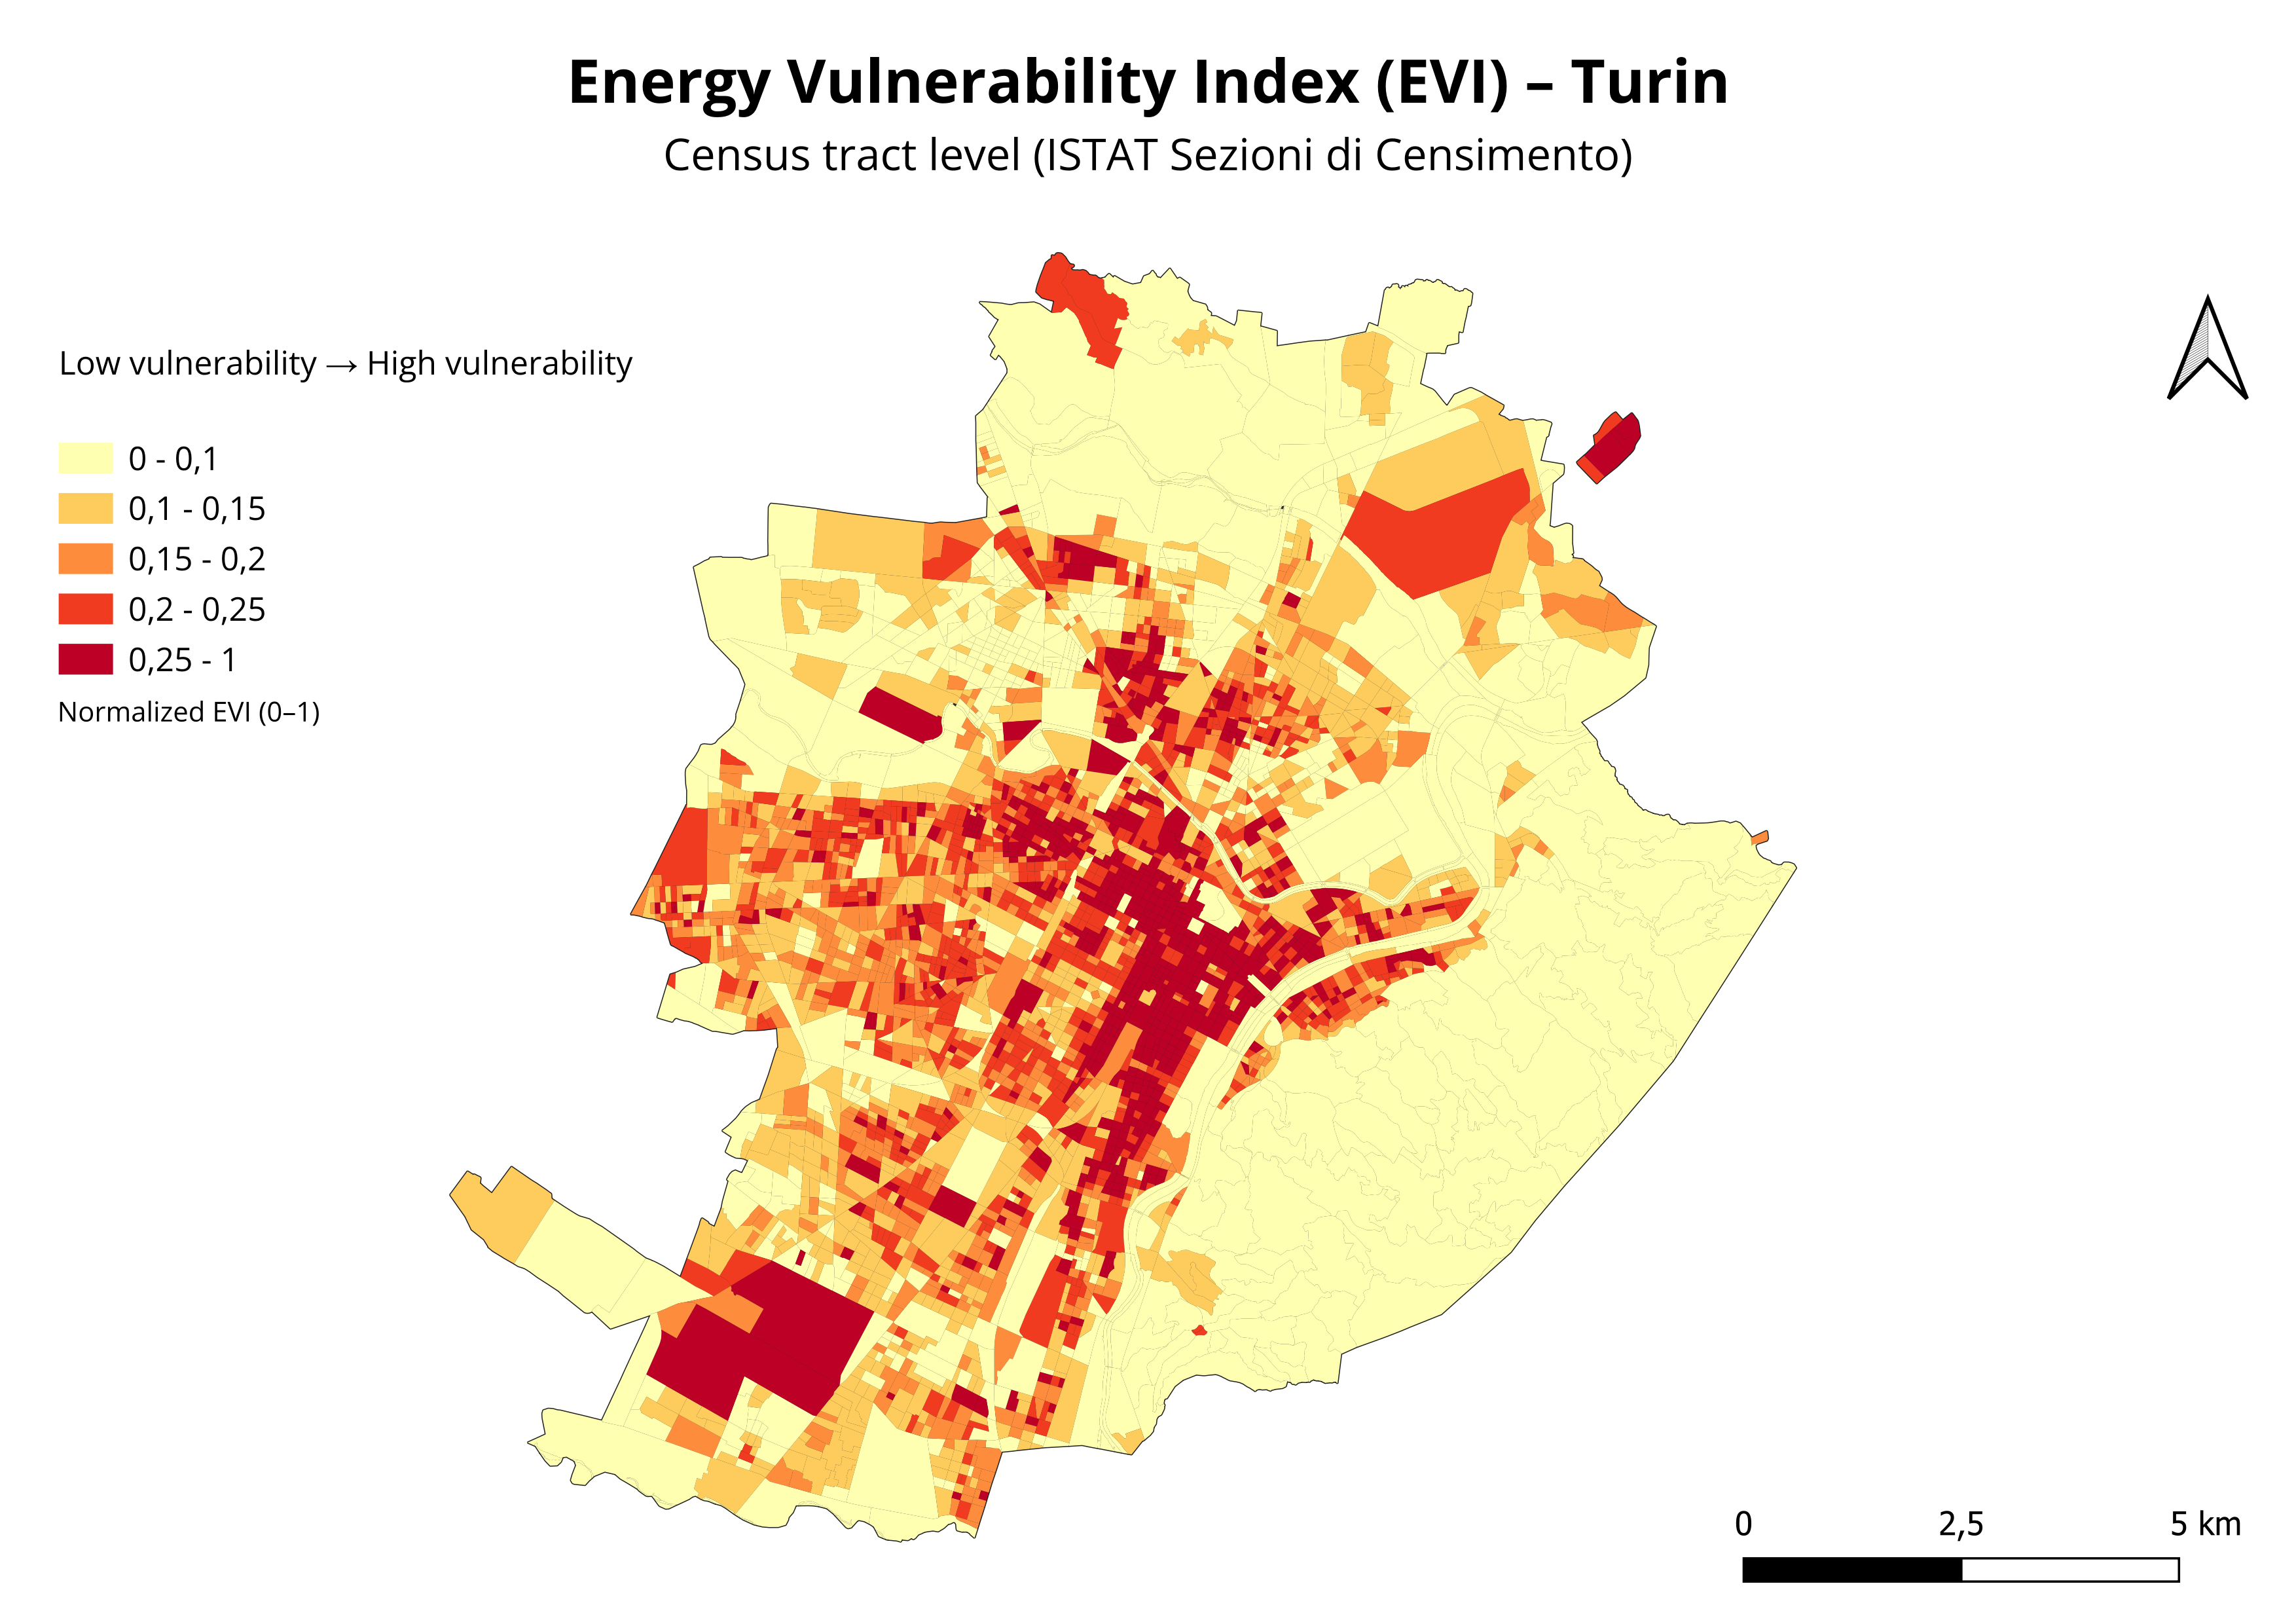
Identify which census tracts in Turin concentrate the highest energy vulnerability, combining socioeconomic, housing and demographic indicators to support targeted policy intervention.
Construction of a composite Energy Vulnerability Index (EVI) using normalized indicators from ISTAT census data at the finest available spatial resolution. Spatial autocorrelation analysis with Getis-Ord Gi* hotspot detection and Local Indicators of Spatial Association (LISA) to identify statistically significant vulnerability clusters.
High-resolution vulnerability maps and cluster analysis revealing spatial patterns invisible in aggregate statistics — enabling decision-makers to prioritize intervention areas with precision.
🎯 Business Impact: Helps environmental agencies and urban developers comply with European sustainability directives by pinpointing exact vulnerability hotspots, optimizing budget allocation and reducing operational risk.
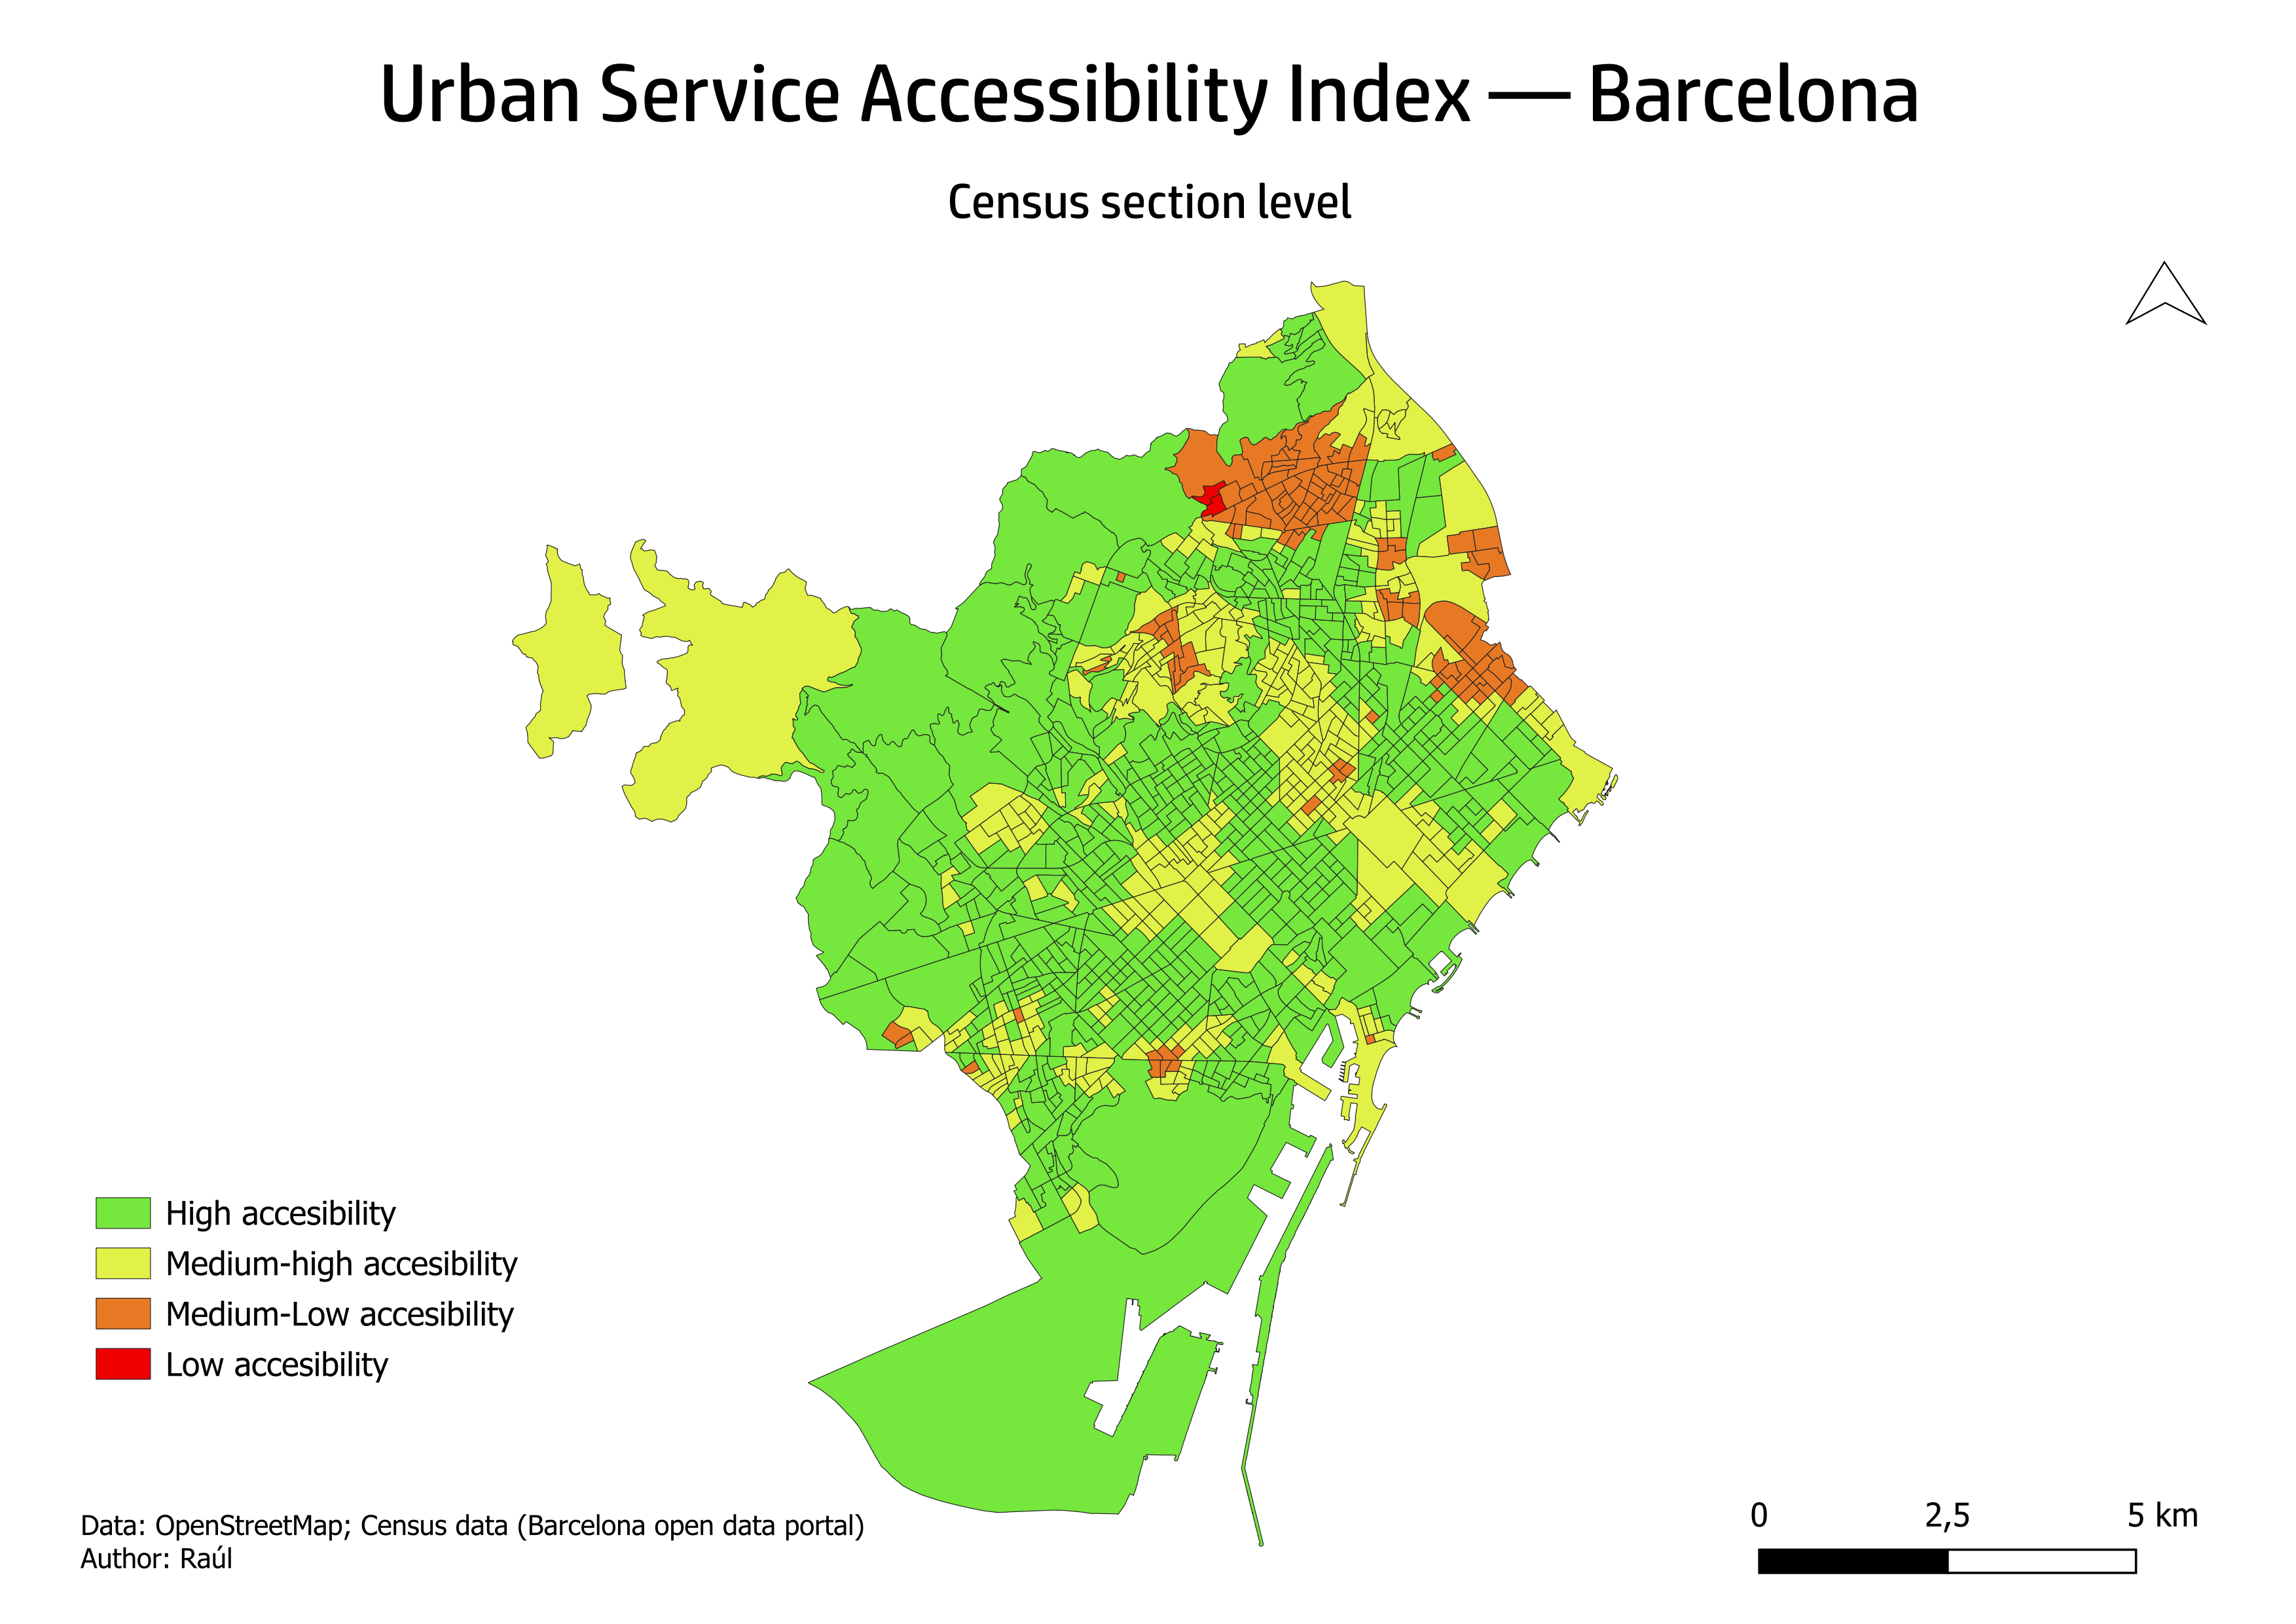
Measure the real accessibility of urban services across Barcelona's census sections to identify underserved areas and support urban planning decisions.
Construction of a composite Urban Service Accessibility Index integrating OpenStreetMap data and Barcelona's open data portal at census section level. Multi-criteria spatial analysis combining proximity, density and coverage of key urban services.
Accessibility classification map identifying high, medium-high, medium-low and low accessibility zones — providing a spatial evidence base for equitable urban service planning.
🎯 Business Impact: Provides real estate developers and city planners with a data-driven evidence base to assess site viability and identify hidden market gaps across urban sectors.
Static heat maps show where it is hot. This platform shows which assets are exposed. It scores 2,000+ individual properties with a 0–100 Thermal Vulnerability Index, giving investors, insurers and ESG teams defensible evidence for valuation, underwriting and certification.
Real estate developers, insurers and urban planners need to financially quantify climate risk at the parcel level. Traditional static heat maps cannot show which assets face devaluation risk, which occupants are most exposed, or where an ESG investment delivers the greatest risk reduction.
The result is underwriting without spatial evidence and sustainability capital allocated by instinct.
I built an end-to-end spatial data pipeline that cross-references extreme urban heat stress with sociodemographic vulnerability to produce an auditable Thermal Vulnerability Index for every asset in the Brickell Financial District, Miami.
Clients upload a portfolio (CSV or GeoJSON) to an interactive dashboard and receive an automated thermal risk report for each property.
Docker (Infrastructure as Code) running PostgreSQL + PostGIS. One command reproduces the full environment for any client or team.
Python pipelines (pandas, rasterio, SQLAlchemy, GeoAlchemy2) extract, clean and bulk-load multi-source open data.
Land Surface Temperature from Landsat 8; building footprints and urban tree canopy from OpenStreetMap; population and census microdata from WorldPop and local census sources.
Heavy analytics run inside the database: ST_SummaryStats for mean temperature per census block; ST_Intersects and ST_Area for tree canopy coverage per city block.
Pushing spatial computation into PostGIS keeps the platform fast, reproducible and scalable as portfolios grow.
Replace blanket assumptions with a ranked, parcel-specific view of devaluation and underwriting exposure.
Prioritize retrofit, shading and canopy investments where they deliver the highest risk reduction per dollar.
Reproducible spatial justification supporting LEED and BREEAM documentation and faster reporting cycles.
Composite index construction combining socioeconomic, environmental and demographic indicators. Spatial statistics including hotspot detection (Gi*) and LISA cluster analysis. Census-level mapping and executive report with policy-oriented conclusions.
Land Surface Temperature retrieval from Landsat satellite imagery. Thermal classification and neighborhood-level analysis. Spatial evidence for heat action planning, tree-canopy prioritization and climate-resilience investment.
Service accessibility modeling at neighborhood or census section level. Gap identification and spatial pattern analysis. Cartographic deliverables and data-driven recommendations for urban planning.
GIS-based land analysis integrating remote sensing data (NDVI, slope, land cover). Spatial integration of multiple environmental and productive variables. Suitable for agricultural, environmental and land management projects.
I am a GIS analyst with a background in Environmental Sciences, specializing in spatial vulnerability, territorial risk and urban resilience. My work sits at the intersection of rigorous spatial methodology and practical decision-making — translating complex geographic data into clear, actionable insights for organizations working on urban, environmental and policy challenges.
I work at census-level precision, applying composite index construction, spatial autocorrelation analysis and cluster detection to identify patterns that aggregate statistics cannot reveal. My projects are designed not only to be technically sound but to communicate results clearly to both technical teams and policy audiences.
I work remotely with international clients across Europe, North America and Latin America. If you have a project that requires serious spatial analysis, clear cartography and a structured report, I would be glad to discuss it.
I am currently available for international freelance projects. If you are working on urban, environmental or territorial challenges that require rigorous spatial analysis, feel free to reach out.